What is BMI and How is it Calculated?
Body Mass Index (BMI) represents a standardized measurement derived from an individual's mass (weight) and height. Calculated as body mass divided by the square of body height, BMI is expressed in units of kg/m². This measurement originated in the 19th century through the work of Belgian statistician Adolphe Quetelet and has evolved into a globally recognized screening tool for weight categorization.
BMI Formula Explained
The fundamental BMI formula operates on a straightforward principle: BMI = weight (kg) ÷ height² (m). For imperial measurements, the calculation transforms to BMI = (weight (lbs) ÷ height² (in)) × 703.
Metric Formula:
BMI = weight (kg) / (height (m))²
Imperial Formula:
BMI = (weight (lb) × 703) / (height (in))²
Example Calculation
For example, a person who weighs 70 kg and is 1.75 m tall would calculate their BMI as follows:
BMI = 70 / (1.75 × 1.75) = 22.86
Modern medical practice employs BMI as an initial screening instrument rather than a diagnostic tool. The World Health Organization (WHO) established international BMI classifications that define underweight (below 18.5), normal weight (18.5–24.9), overweight (25–29.9), and obese (30+) categories.
BMI Categories (Underweight, Normal, Overweight, Obese)
BMI classifications provide a standardized framework for understanding weight-related health risks. Each category correlates with specific health considerations and recommended actions.
| BMI Range |
Classification |
Health Considerations |
Recommended Actions |
| < 18.5 |
Underweight |
Potential nutritional deficiencies, osteoporosis risk, weakened immunity |
Nutritional assessment, gradual weight gain strategy, medical consultation |
| 18.5 – 24.9 |
Normal Weight |
Optimal health range, lowest mortality risk from weight-related conditions |
Maintenance through balanced diet and regular physical activity |
| 25.0 – 29.9 |
Overweight |
Increased cardiovascular risk, potential metabolic changes |
Moderate weight loss (5–10% of body weight), lifestyle modifications |
| 30.0 – 34.9 |
Obese Class I |
Significant health risk elevation, likely metabolic syndrome indicators |
Structured weight management program, medical supervision |
| 35.0 – 39.9 |
Obese Class II |
High risk of comorbidities, substantial quality of life impact |
Comprehensive medical intervention, potential pharmacological treatment |
| ≥ 40.0 |
Obese Class III |
Severe health risks, significant mortality increase |
Multidisciplinary medical care, potential surgical consideration |

Comprehensive BMI classification chart based on WHO standards
How to Use This BMI Calculator
Our intuitive BMI calculator delivers instant results through a streamlined three-step process designed for maximum accuracy and user convenience.
Step 1: Input Personal Information
Begin by entering your age and selecting your gender. For children and adolescents (ages 2–19), these details enable percentile calculations based on CDC growth charts. Adult calculations (20+ years) utilize standard BMI categories regardless of gender, though age provides context for result interpretation.
Step 2: Enter Height and Weight
Select your preferred measurement system—metric (centimeters and kilograms) or imperial (feet/inches and pounds). Input your current height and weight values. The calculator automatically converts between systems and displays your healthy weight range based on height alone.
Step 3: Review Comprehensive Results
Upon calculation, you'll receive your BMI numerical value, weight category, personalized health insights, and visual representations on our interactive BMI meter and chart. The system also generates tailored recommendations based on your specific results.
For optimal accuracy, measure height without shoes and weight with minimal clothing. Morning measurements typically provide the most consistent results as body weight fluctuates throughout the day.
BMI for Adults vs. Children
BMI interpretation differs fundamentally between adults and children due to dynamic growth patterns and developmental variations.
Adult BMI Interpretation
For individuals aged 20 years and above, BMI interpretation follows standardized international classifications established by the World Health Organization. These categories apply uniformly across adult populations regardless of gender, though research indicates subtle variations in optimal ranges between sexes.
Pediatric BMI Assessment
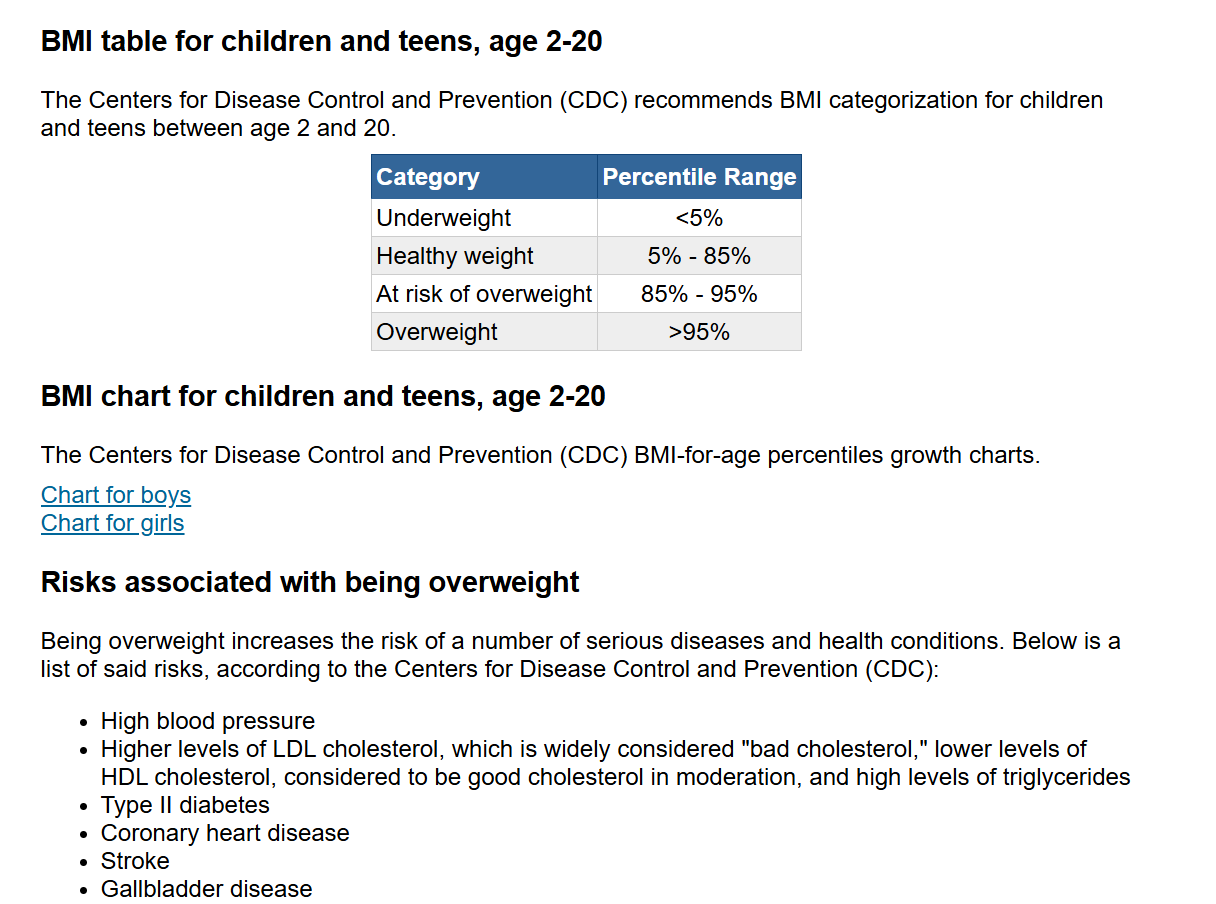
Children and adolescent BMI interpretation diverges from adult classifications. The Centers for Disease Control and Prevention (CDC) utilize age- and sex-specific percentiles rather than fixed numeric thresholds.
CDC BMI-for-age growth chart illustrating percentile-based classifications
Percentile-Based Classifications for Children:
- Underweight: BMI below 5th percentile for age and sex
- Healthy Weight: BMI between 5th and 85th percentiles
- Overweight: BMI between 85th and 95th percentiles
- Obese: BMI at or above 95th percentile
Health Risks Associated with BMI
Extensive epidemiological research establishes clear correlations between BMI classifications and specific health outcomes.
| Health Condition |
Overweight Risk Increase |
Obese Risk Increase |
Mechanisms |
| Type 2 Diabetes |
3x |
7x |
Insulin resistance, pancreatic stress |
| Hypertension |
2x |
4x |
Volume overload, sympathetic activation |
| Coronary Artery Disease |
1.5x |
2.5x |
Dyslipidemia, endothelial dysfunction |
| Sleep Apnea |
2x |
4x |
Airway compression, ventilatory control |
| Osteoarthritis |
1.5x |
3x |
Mechanical loading, inflammation |
| Certain Cancers |
1.3x |
1.5–2x |
Hormonal, inflammatory pathways |
Type 2 diabetes risk shows the strongest BMI correlation—each 5-unit increase raises risk approximately 67%. Cardiovascular conditions follow closely, with 29% higher coronary disease risk per 5 BMI units.
How to Maintain a Healthy BMI
Sustainable BMI management integrates nutritional science, behavioral psychology, and physiological principles.
Nutritional Optimization
Prioritize nutrient density over calorie counting alone. The Mediterranean dietary pattern—emphasizing vegetables, fruits, whole grains, legumes, nuts, and olive oil—demonstrates superior weight maintenance outcomes.
Physical Activity Integration
The American College of Sports Medicine recommends 150–250 minutes weekly of moderate activity for weight maintenance, with 250+ minutes for weight loss. Optimal programming includes resistance training twice weekly and daily movement.
Behavioral Modifications
Successful weight maintainers demonstrate common behaviors: consistent breakfast consumption, weekly self-weighing, 60+ minutes daily activity, and limited television viewing.
Limitations of BMI
While valuable for population screening, BMI possesses well-documented limitations in individual assessment.
Key Limitations
Body Composition Blindness: BMI cannot distinguish between lean mass and adipose tissue. Athletic individuals with elevated muscle mass frequently register falsely elevated BMI values.
Fat Distribution Ignorance: Central adiposity (abdominal fat) demonstrates stronger metabolic and cardiovascular correlations than peripheral fat. Waist circumference provides superior risk stratification.
Ethnic Variations: Asian populations experience elevated metabolic risks at lower BMIs, prompting revised thresholds: overweight (23–27.4) and obese (≥27.5).
Complementary Assessment Tools
- Waist-to-Hip Ratio: Superior cardiovascular risk predictor (healthy: <0.90 men, <0.85 women)
- Body Fat Percentage: Measured via DEXA, BIA, or skinfold calipers (healthy ranges: 8–19% men, 21–33% women)
- Biomarker Analysis: Blood pressure, lipid profile, fasting glucose, HbA1c
Common Questions About BMI
BMI measures body fat based on your weight in relation to your height. It provides a simple numeric measure that categorizes individuals as underweight, normal weight, overweight, or obese.
BMI may not be accurate for athletes, bodybuilders, pregnant women, or the elderly. It doesn't distinguish between muscle and fat mass. For muscular individuals, BMI may overestimate body fat, while for older adults with less muscle mass, it may underestimate body fat.
Both systems give identical results. Metric units (kg and cm/m) are used in most countries worldwide and provide simpler calculations. Imperial units (lbs and ft/in) are primarily used in the United States. Our calculator automatically handles both systems with the same accuracy.
For adults, a BMI between 18.5 and 24.9 is considered healthy. Below 18.5 is underweight, 25-29.9 is overweight, and 30 or above is obese. The optimal range for minimal health risk is typically 22-25.
Yes, children ages 2-19 can use this calculator. However, BMI interpretation for children uses percentiles based on age and gender rather than fixed categories. The calculator automatically adjusts for pediatric measurements and provides percentile-based results.
Monthly checks are sufficient for most adults. If you're actively trying to lose or gain weight, checking every 2-4 weeks can help track progress. Daily or weekly measurements aren't necessary as weight naturally fluctuates.
While BMI is a good screening tool, waist circumference, waist-to-hip ratio, and body fat percentage provide more accurate health assessments. These measurements better account for muscle mass and fat distribution.
BMI thresholds may need adjustment for different ethnicities. Asian populations often have higher health risks at lower BMI levels, with overweight starting at 23 instead of 25. Always consider ethnicity alongside other health factors.
Evidence-Based Health Optimization Strategies
Nutritional Foundations
Prioritize whole foods over processed alternatives—each 10% increase in ultra-processed food consumption correlates with 12% higher obesity risk. Emphasize protein (0.8–1.2g/kg) and fiber (30g+ daily) for satiety and metabolic benefits.
Activity Integration
Incorporate resistance training twice weekly alongside 150+ minutes of moderate cardio. Non-exercise activity thermogenesis (NEAT) accounts for substantial calorie expenditure—increase standing, walking, and daily movement.
Sleep Optimization
Achieve 7–9 hours quality sleep nightly—sleep deprivation disrupts leptin/ghrelin balance, increasing appetite 20–25%. Maintain consistent sleep schedules and create dark, cool sleeping environments.
Stress Management
Chronic elevation elevates cortisol, promoting abdominal fat deposition. Implement daily stress-reduction practices: mindfulness meditation, nature exposure, deep breathing, or progressive muscle relaxation.
Hydration Strategy
Consume 30–35ml water per kg body weight daily. Pre-meal water consumption reduces calorie intake 13%. Replace sugar-sweetened beverages with water—each daily serving increase correlates with 0.5kg annual weight gain.
Meal Timing
Consider time-restricted eating within 8–12 hour windows—research demonstrates metabolic benefits independent of calorie reduction. Avoid late-night eating, particularly within 3 hours of bedtime.
Explore Our Health & Wellness Calculators
Calculator Premium offers specialized tools for comprehensive health management. Each calculator provides accurate, instant results with detailed explanations.
Medical Disclaimer
This BMI calculator provides estimates based on standard formulas and should not replace professional medical advice. Individual health status depends on numerous factors beyond BMI measurements.
Consult healthcare professionals for personalized health assessments, particularly if your BMI indicates underweight, overweight, or obese categories. This tool serves educational purposes and cannot diagnose medical conditions.
Calculator Premium ensures calculation accuracy but recommends verification with healthcare providers for medical decisions. Results represent statistical probabilities rather than individual certainties.